Application Note: Targeted Nanoindentation of a High-Entropy Alloy in the SEM
Investigating the Mechanical Properties of High-Entropy Alloys Using In-Situ SEM Nanoindentation
High-entropy alloys are a promising class of novel engineering materials that potentially possess better specific strength, fracture toughness and corrosion resistance than existing structural materials, along with several other unique properties [1]. This is potentially due to the operation of diverse deformation mechanisms, allowing for crack bridging as an extrinsic toughening mechanism, for example [2]. These materials remain an active area of research due to their complex mechanical behavior, and their use as a practical structural material requires further investigation. One area still requiring study is processing routes, where plastic strain and heat treatment are used to achieve a desired microstructure, similar to other structural metals. Also, similar to existing duplex steels, an HEA with both hard and soft phases would be desirable. One example of such a material is a eutectic alloy [3], as is presented here. This HEA is composed of lamellar phases, which are sub-micron in thickness. Thus, to evaluate the mechanical properties of each phase individually, nanomechanical testing techniques are required.
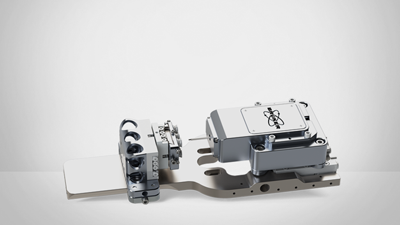
This application note discusses the application of in-situ SEM nanoindentation with the Hysitron® PI 88 SEM PicoIndenter® to this material to investigate the accommodation of plastic strain as a part of exploring processing routes.
KEYWORDS: Nanoindentation; PI 88; SEM PicoIndenter; Plastic Strain; EBSD; High-Entropy Alloy; Tilt and Rotation Stage
Experimental Procedure
The high-entropy alloy utilized for this study was as cast, and was prepared using conventional mechanical polishing and a final chemo-mechanical vibratory polish with colloidal silica. This material had a composition of AlCoCrFeNi2.1 and separated into two high-symmetry crystal phases, FCC (L12) and BCC (B2) phases, with about 65-35% volume fraction distribution, respectively [3]. This is shown by electron backscatter diffraction (EBSD) in Figure 1. In Figure 1a, the two phases as identified by EBSD are marked, with the FCC phase in green and the BCC phase in red. In Figure 1c, the inverse pole figure map indicates that the same orientation is maintained with an individual “fiber” of the microstructure, which is an elongated lamellar structure. Indentation tests targeting specific parts of the microstructure was performed in-situ SEM using the Hysitron PI 88 equipped with a Berkovich geometry probe in load control, with partial unload indents to measure the depth dependence of the properties. The indentation testing was performed at tilt to allow visualization of the test, and the optional rotation and tilt staging of the Hysitron PI 88 was used to reorient the specimen, post-mortem, with the electron column for backscatter (BSE) imaging and phase identificaton of the indent locations.
Results
For the in-situ SEM indentation, regions were selected that represented different parts of the materials microstructure. Three example indentation regions are compared in Figures 2 and 3. In Figure 2, post-indent imaging is shown for these regions, in backscatter electron mode and secondary electron mode, both from a top view and a tilted view, respectively. Region 1 is within the minor BCC phase, which appears slightly darker than the FCC phase. Region 2 is a combination of the two phases, while Region 3 is predominantly within the FCC phase. In the post-indent imaging, slip steps are not apparent in Region 1, while they do occur in Regions 2 and 3 within the FCC phase. This is reasonable, as slip by dislocation is more easily promoted in the FCC crystal structure. It can also be observed in Regions 2 and 3 that the slip steps pile up against the nearby BCC phase boundary.
The hardness data in Figure 3 is correlated to the propensity to form slip steps from the images in Figure 2. In Region 1, the hardness is relatively constant with depth at ~10 GPa. In Region 2, the hardness is similar to Region 1 at the lowest depths, which is reasonable as the center portion of the indent is in the BCC phase. However, as the depth increases, the hardness drops as increasing amounts of FCC phase is incorporated in the plastic zone of the indent. The hardness approaches that of Region 3, which is predominately within the FCC Region. This has a relatively constant hardness around 6 GPa. These observations are consistent with TEM analysis of cold-rolled material, where it was observed that the BCC phase largely retained its structure, while the FCC grain structure deformed around it [3].
Conclusions
In-situ SEM indentation is a powerful tool for characterizing the mechanical properties of individual portions of the microstructure in emerging alloys. Here, EBSD and backscatter were incorporated into the nanoindentation analysis using the tilt and rotation stages of the Hysitron PI 88. This additional data, helped to interpret the measured hardness and observed slip steps in the post-indent imaging. For this alloy, the relative hardnesses of the phases and the pile up of dislocations at the phase boundary play an important role in determining the plastic deformation of the bulk material.
References
- M.-H. Tsai, J.-W. Yeh, Mater. Res. Lett. 2 (2014) 107–123.
- Z. Zhang, H. Sheng, Z. Wang, B. Gludovatz, Z. Zhang, E.P. George, Q. Yu, S.X. Mao, R.O. Ritchie, Nature Comm. 8 (2017).
- I.S. Wani, T. Bhattacharjee, S. Sheikh, I.T. Clark, M.H. Park, T. Okawa, S. Guo, P.P. Bhattacharjee, N. Tsuji, Intermetallics 84 (2017) 42-51.
Bruker Nano Surfaces Division is continually improving its products and reserves the right to change specifications without notice. Hysitron and PicoIndenter are trademarks of Bruker Corporation. All other trademarks are the property of their respective companies. © 2017 Bruker Corporation. All rights reserved. AN1507, Rev. A0

