Application Note: High-Resolution Chemical Imaging with Tapping AFM-IR
Overcome limitations in nanoparticle analysis with Tapping AFM-IR
Infrared (IR) spectroscopy is one of the most recognized analytical measurement techniques for the characterization of materials in academic, government, and industrial R&D laboratories. The spatial resolution of conventional bulk IR spectroscopy is limited by diffraction to around 3-10 µm, depending on the method used. Atomic force microscopy (AFM) is a widely used nanoscale imaging technique that provides the user with a high spatial resolution topographic map of a sample surface. Until now, the major drawback of AFM has been its inability to chemically characterize the material underneath the tip. AFM-IR is a photothermal technique that combines AFM and IR spectroscopy to unambiguously identify the chemical composition of a sample with tens-of-nanometers spatial resolution. So far, it has been successfully used in contact mode in a variety of applications. However, contact mode has proven unsuitable for soft or loosely adhesive samples, such as the less than 200 nm polymeric nanoparticles (NPs) that are of wide interest for biomedical applications. This application note discusses how Tapping AFM-IR overcomes such limitations, bringing the power of both IR spectroscopy and AFM topography mapping to a much wider range of applications.
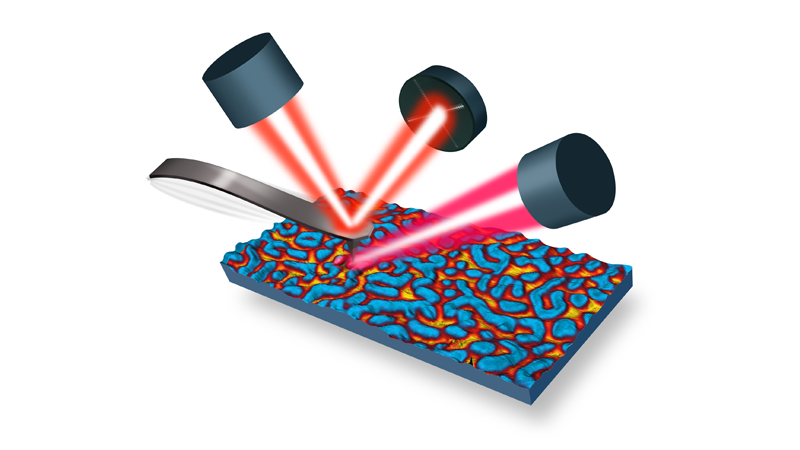
When the sample absorbs photons from a pulsed tunable monochromatic IR laser light source, it heats up and rapidly expands, inducing an impulse to the AFM probe in contact with the sample. This causes an oscillation of the AFM cantilever at its contact resonant frequencies. The amplitude of each of the contact resonant frequencies has been proven to be proportional to the IR absorbance. As a consequence, by tuning the laser through a range of wavenumbers, an IR spectrum can be collected that correlates with conventional Fourier transform infrared (FT-IR) spectra. The spatial resolution of the measurement is no longer limited by the diffraction-limited spot size of the IR beam, but instead, is determined by a number of factors including the diameter of the AFM tip, which is on the order of 10-30 nm. The use of fast, tunable pulsed IR laser sources with variable repetition rates, such as quantum cascade lasers (QCLs), has significantly improved the speed and sensitivity of photothermal AFM-IR, and has also enabled the measurement of IR spectra in AFM tapping mode.1,2
Principles of Tapping AFM-IR
AFM-IR spectra are typically collected with the AFM probe in direct contact with the surface of the sample. This is not a problem when collecting point spectra where the AFM tip is held at a fixed location on the sample, unless the sample is particularly soft or mobile. However, during IR image acquisition, where the IR source wavelength is fixed and the AFM tip is scanned across the sample surface, the contact mode can be more problematic for soft or loosely adhered samples.
Broadening the AFM-IR technique to include softer samples was enabled by the development of tapping mode–based IR measurements, where the tip is not continuously in contact with the sample but instead taps, making intermittent contact with the surface. This allows highly reproducible imaging of a broader range of samples, even if they are very soft or loosely adhered. Tapping mode is typically performed by driving the AFM cantilever at its fundamental free resonance and bringing the AFM tip down to the sample such that the amplitude is limited by contact with the sample surface. The tip is then scanned across the sample surface and the topography of the sample is recorded by maintaining a constant oscillation amplitude.
Tapping AFM-IR is typically performed in a manner similar to standard tapping mode by tapping at the fundamental free resonance of the cantilever, but in addition, the IR laser focused at the tip-sample location is pulsed at higher repetition rates. When a particular laser wavenumber excites an IR absorption band of the sample, it will induce heating and an oscillating photothermal expansion of the sample. The highest signal would be achieved by pulsing the laser directly at a cantilever resonant frequency. In this case the oscillation amplitude would be enhanced by the quality factor of the corresponding AFM cantilever mode. To achieve local measurements, a heterodyne approach is used in which the repetition rate of the laser is set to the difference frequency of the fundamental and second flexural eigenmodes of the AFM cantilever. The non-linearity of the force interaction in tapping mode mixes the tapping oscillation with the sample photothermal expansion at the sum frequency, generating amplitude at the second mode of the cantilever. An alternative approach to this measurement is to perform the tapping oscillation at the second mode of the cantilever, and sense the IR absorption using the fundamental mode. In either case, the signal is dominated by the local signal during the tip-sample contact, and the AFM tip radius only limits the spatial resolution. Measurements using this technique have demonstrated a spatial resolution of 10 nm.
Sub-10 nm Spatial Resolution Tapping AFM-IR Chemical Imaging of a Block Copolymer
Figure 2a shows a tapping AFM height image of a thin film of a block copolymer of polystyrene (PS) and polymethyl methacrylate (PMMA). Although it is clear there are two domains present, it is impossible to determine the chemical makeup of the individual domains from the AFM height image alone. When the pulsed QCL is tuned to the fixed wavenumber of 1732 cm-1 (where PMMA has a strong IR absorption band), an enhanced signal intensity is detected when the AFM tip contacts a PMMA domain in the sample and the QCL repetition rate is matched to the difference frequency between the first and second AFM cantilever modes. The sample is then scanned in AFM tapping mode, leaving the QCL repetition rate and wavenumber fixed. When the AFM tip intermittently contacts a PMMA domain, a strong resonant response results. When the AFM tip moves to a PS domain location, the signal gets much weaker for two reasons: 1) the PS domains do not absorb IR laser radiation at 1732 cm-1 as strongly as the PMMA domains; and, 2) the mechanical stiffness of the PS domains are different than the PMMA domains, which causes a shift in the second contact resonance peak frequency from its value when the tip intermittently contacts the PMMA domains (i.e., the signal is less enhanced due to the fact that the frequency difference between the two cantilever resonance modes no longer matches the QCL repetition rate). To selectively enhance the PS domains in the block copolymer film, the laser wavenumber is changed to 1492 cm-1, where PS has a strong IR absorbance, and the QCL repetition rate is adjusted to match the difference between the AFM fundamental resonant frequency and the frequency-shifted second AFM cantilever mode. An overlay of the Tapping AFM-IR images collected at 1732 and 1492 cm-1 is shown in Figure 2e. The collection of full AFM-IR spectra (in either contact mode or tapping mode) is necessary to confirm the assignments of the polymer domains to the proper specific chemical species. The green Tapping AFM-IR spectrum shown in Figure 2b (collected in a green domain) is consistent with enriched PMMA content, while the red spectrum (collected in a red domain) is consistent with higher PS content.
Sub-10 nm Spatial Resolution Chemical Imaging and Spectroscopy of a Biological Membrane
Figure 3 shows Tapping AFM-IR absorbance images and spectra of a 5-nm-thick film of purple membrane deposited on a template-stripped Au substrate. The observed difference in the ratio of relative intensities of the amide I band at 1660 cm-1 and the amide II band at 1542 cm-1 is likely due to an orientation difference of the polypeptide chains, as the exciting QCL radiation is polarized normal to the surface. The Tapping AFM-IR absorbance image was collected with QCL wavenumber tuned to 1660 cm-1. Island regions of the protein component of the purple membrane are clearly apparent in the IR absorbance image. A plot of the 1660 cm-1 band intensity taken from the dotted line on the IR absorbance image demonstrates we have achieved a spatial resolution of about 4 nm.
Sub-10 nm Spatial Resolution Chemical Imaging and Spectroscopy of a Graphene Wedge
Figure 4 shows scattering scanning nearfield optical (s-SNOM) reflection, absorption, and phothothermal Tapping AFM-IR images recorded at 930 cm-1 of a graphene wedge deposited on a flat silicon substrate. The surface plasmon polaritron signal near the edge is clearly visible in the photothermally detected image due to the mechanical resonance enhancement of this region of the sample.
Biomedical Application of Tapping AFM-IR to Polymeric Nanoparticles
As mentioned above, contact mode AFM-IR is typically unsuitable for soft or loosely adhesive samples, such as polymeric nanoparticles (NPs) of less than 200 nm, which are of wide interest for biomedical applications. Figure 5 shows that Tapping AFM-IR allows accurate visualization both of the location of the NPs’ shells and that of the incorporated material. Nowadays, poly(lactic acid) (PLA) and poly(D,L-lactic-co-glycolic acid) (PLGA) polymers are the most employed biomaterials to prepare drug nanocarriers. Tapping AFM-IR allows simultaneous imaging of spherical PLA/PLGA NPs without distorting or displacing them, in spite of their loose interaction with the AFM substrate. Besides the improved topography, the superiority of tapping over traditional contact was striking when investigating the chemical composition of the PLA NPs by recording the IR signals of their components. PLA NPs were prepared using polyvinyl alcohol (PVA), the most commonly used surfactant, which confers colloidal stability. The general assumption is that these NPs possess a core (PLA or PLGA)–shell (PVA) structure. The Tapping AFM-IR method unambiguously proved the existence of a hydrophilic surfactant corona around the NPs core with high resolution. These studies pave the way toward the use of Tapping AFM-IR to control the quality of NP formulations based on individual NP detection and component quantification.
Figure 5. Comparison of contact mode AFM-IR (a) and Tapping AFM-IR (b, c) chemical maps on PLA NPs, and a schematic illustration of the NPs drying process on the AFM substrate (d). The 3D overlaid (topography and IR absorption) views clearly illustrate the topographic variations induced by the AFM acquisition mode. For (a) and (b), red represents the strong absorption of the ester carbonyl band of the PLA core at 1760 cm-1 and for (c), red represents the strong absorption of the C H– bending and of the PVA corona at 1415 cm-1. In (d), the cores and the shells are schematically represented in red and blue, respectively.
Adapted from Mathurin, et al., Analyst, 2018, DOI: 10.1039/c8an01239c
Conclusions
Tapping AFM-IR has not only improved the resolution of nanoscale IR spectroscopy by an order of magnitude, but it has also extended the range of applications that can be addressed, providing new nanoscale chemical information for applications covering polymeric materials, fibers, catalysis, metal oxide frameworks, biomedical, among many others.
References
- Centrone et al., Analyst, 2018, 143, 3808-3813, DOI: 10.1039/c8an00838h.
- Methune, et al., Analyst, 2018, DOI: 10.1039/c8an01239c
© 2019 Bruker Corporation. Anasys is a trademarks of Bruker Corporation. All other trademarks are the property of their respective companies. All rights reserved. AN201, Rev. A0.


